Introduction: Why Coffee Shop Data Matters More Than Ever
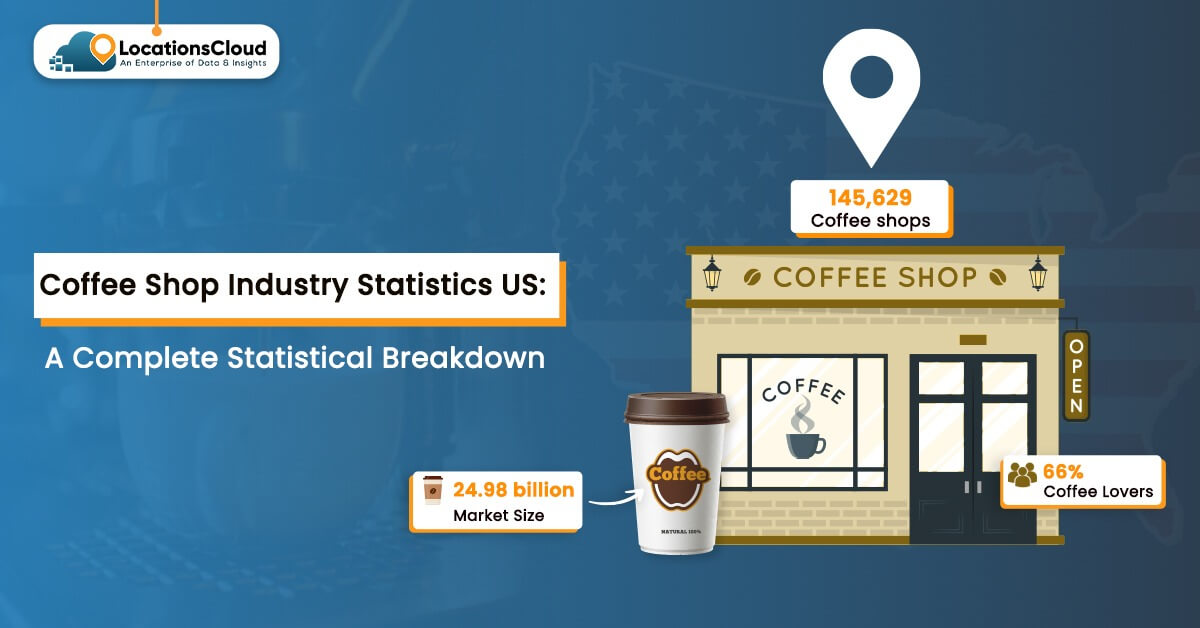
There are a total of 145,629 coffee shops in the US, with a market size of 24.98 billion in 2026. These coffee shops bring in $75.5 million in revenue every year. The growth of the coffee shop industry in the US reflects a strong consumer preference for both local cafes and major chains. Entrepreneurs now rely on coffee shops as vital, productive workspaces rather than just places for a quick caffeine fix. This is a great opportunity for a retailer, investor, franchise operator, or real estate analyst to gather accurate coffee shop location intelligence analysis to determine profitability before investing. LocationsCloud provides this B2B coffee location data in the USA for competitive analysis and site selection.
Total Number of Coffee Shop Industry Statistics in The US
The analysis below describes the top 10 coffee shop industry statistics by state.
- California: 4,063
- New York: 2,507
- Texas: 2,355
- Florida: 1,910
- Illinois: 1,483
- Massachusetts: 1,374
- New Jersey: 1,239
- Pennsylvania: 1,139
- Ohio: 1,035
- Michigan: 977
The above statistics show that California’s share is the highest. If we consider it in percentage, then it is ~7.8% of all U.S. coffee shops. California has a large customer base, so it is likely to have a higher coffee shop count than other states in the USA. Coffee shop chains like Starbucks, Peet’s, and Dunkin’ are the major coffee brands being discussed in the food and beverage service industry.
| Category | Chains | Independent |
| Number of coffee shops in the US | ~80,000 nationwide | ~64,697 nationwide |
| Growth Rate | ~2% annually | ~3.2% annually (faster growth) |
| Revenue Share | The majority of the $75.5 billion industry revenue | Smaller share, but rising |
| Consumer Base | Convenience-driven and brand loyalty. | Specialty coffee lovers, local community. |
| Strengths | Scale, consistency, and tech integration. | Craft, uniqueness, community engagement. |
| Challenges | Tip fatigue, rising costs, and market saturation. | High rent, competition, and limited marketing budgets. |
As we look to 2026, fast-food chains are scaling for speed, leaving premium, handcrafted experiences to independent operators. Big coffee chains are struggling to sustain growth, fighting a crowded market and higher costs despite their massive app-based convenience.
On the flip side, independents are growing faster, even though there are fewer of them.
By focusing on specialty goods, local roots, and genuine community engagement, they win over younger shoppers who crave authenticity and sustainable choices. Independent coffee shops drive industry innovation and cultural trends, leaving large chains to dominate in capital and global reach.
The following points outline the distribution of coffee shops by state.
- Washington: This state has the highest per capita density.
- Oregon: Oregon has a vibrant cafe culture, competing with the coffee shops in Washington.
- Colorado: This state is urbanizing quickly, with hub cities like Boulder and Denver.
- Hawaii: It is a hub for tourism and local coffee.
- California: Coffee shops in this state are larger, but per capita spending is low.
- New York: Covered almost all high-density areas, but the overall per capita metric is low.
The key takeaway of the above point is that states with a smaller coffee culture have a higher per capita density, whereas large population states like California and Washington have low per capita coffee density. Businesses can use location intelligence from locationscloud.com to discover and analyze coffee store density and underserved regions.
Coffee Shop Market Size & Revenue Statistics
The coffee shop market size in the United States and revenue statistics reveal the growth.
- Total Revenue: ~$75.5 billion in 2026.
- Annual Growth Rate: From 2016 to 2026 is ~2.5%.
- 2026 Growth Alone: ~0.2%.
- Profitability Trend: The rising cost of coffee-making materials decreases profit margin.
For businesses, it is important to know the average US coffee shop revenue statistics to thrive in the market. We divide our analysis by type of revenue and type of average revenue.
| Type of Shop | Revenue |
| Small independents | $60K–$160K annually |
| Mid-size urban cafes | $250K–$400K annually |
| Large chain locations | $500K+ annually |
| Monthly range (overall) | $9K–$52.5K per month |
Small, independent, and mid-size urban cafes have lower and moderately steady annual earnings. On the other hand, large chain locations have high monthly revenue. If we look at the monthly range, then it shows wide variations in earnings. Apart from this, the overall industry growth rate is ~0.2% YoY in 2026, which means a minimal yearly increase with industry slowdown evident.
The branded franchises/chains contribute ~70–75% of total revenue, and the independent cafes contribute ~25–30% of total revenue. Therefore, investing in franchisees is more profitable than a typical independent cafe. The US consumer’s daily consumption is high, with 66% of adults drinking it every day. Major daily drinkers create strong and consistent demand. The bottom line in this section is that investors use B2B coffee location data in the USA to evaluate saturation before funding new outlets.
Coffee Shop Growth Rate Trends in The US (2015–2026)
- Industry CAGR: The industry CAGR from 2015 to 2026 is ~2.5%, which is very slow
- Mobile Ordering: Use of mobile apps increases convenience, and thereby, the trend of loyalty app adoption becomes high.
- Drive-thru Growth: It has increased sales in suburban areas.
- Speciality Coffee Demand: Emerging demand increases margins and strengthens independent growth.
- Post‑Pandemic Recovery: Sales rebounded ~11% annually from 2022 to 2024.
- Regional chain expansion: Biggby and Dutch Bros expanded their business.
- Cold brew and Premium Segment: The premium products are quickly popular among youth, a key demographic driving growth.
The Coffee industry trends in the USA help beverage companies to track industry health and spot slowdowns or resilience. They guide investment choices and identify profitable segments.
Top Coffee Chains vs Independent Shops
| Brand/Segment | Store Count | Growth Rate | States Covered |
| Starbucks | ~16,000+ stores | ~2–3% annually | All 50 states |
| Dunkin | ~9,500+ stores | ~1–2% annually | ~40+ states |
| Dutch Bros | ~850+ stores | ~6–7% annually | ~15+ states |
| Scooter’s Coffee | ~750+ stores | ~5–6% annually | ~30+ states |
| Biggby Coffee | ~350+ stores | ~4–5% annually | ~12+ states |
| Independents | ~64,700 shops | ~3.2% annually | Nationwide |
The above table highlights store count, growth rate, and the states covered by popular brands. The brand Starbucks is the largest food and beverage chain with over 16,000 locations, accounting for 40% of the market. Independent growth is still 3.2% annually nationwide, compared to the rest of the brands. With this highly accurate B2B coffee location data in the USA, businesses can track competitor expansion by ZIP code.
State-by-State Coffee Shop Density By State
Highest Density States like Oregon, California, and New York have the highest number of coffee shops due to urban centers and strong cafe culture. Here, California boasts numerous urban centers with a diverse lifestyle and social hubs. People with high disposable income support premium coffee in this state. In contrast, some underserved states, such as Mississippi, Alaska, and Wyoming, have dispersed populations and therefore have low demand. People in this state have lower disposable income and therefore spend less on premium coffee.
Metro-level Breakdown For Various States in The USA
- NYC: This city has a dense coffee shop structure.
- LA: Laus Angelous, a city known for its entertainment industry, follows a suburban spread pattern.
- Chicago: Downtown Chicago is a hub of cafes.
- Austin: Specialty shops are growing in Austin.
- Seattle: Seattle is home to Legacy coffee hubs.
Metro hubs are the engines of cafe shop expansion. Rural areas without Metro remain underserved. Businesses can focus their market expansion strategy on metro opportunities. Location intelligence helps determine optimal coffee shop site selection based on demographic and competitor proximity data.
Coffee Shop Consumer Behavior Statistics
- Daily coffee drinkers:73% Americans daily
- Weekly shop purchases: 51% buy weekly
- Daily shop purchases: 8% buy daily
- Average cups per day: 3–5 cups (36%)
- At‑home brewing: 66% brew coffee daily
- Favorite brand: 48% Starbucks, 45% Dunkin’
- Average café spend: $20 or less monthly (54%)
- Preferred roast: 49% medium roast
According to the statistics, daily coffee habits among Americans create a steady demand. Shops can see weekly traffic, ensuring a reliable customer base. The deeply integrated cultural habit has made loyalty strong for Starbucks and Dunkin’. Ratio 66% indicates that people like to drink coffee at home, posing a challenge to the cafe industry.
Urban clusters and suburban markets are different in many ways. Urban clusters consist of younger people (18-34) and professionals, whereas the suburban market includes families, older adults, and commuters. Both have varying visit frequencies and spending patterns. Urban consumers drink coffee daily or multiple times weekly, spending an average of $6-$9 per visit. Suburban consumers spend less, averaging $4 to $6.
Investment & Expansion Opportunities
An enthusiast who wants to start a business in coffee can look for some investment and expansion opportunities. The best states for coffee shop demand and strong cafe culture are Washington, New York, and California. Entrepreneurs can also target drive-through opportunity zones and college towns.
Want to Identify the Next High-Growth Coffee Market?
With LocationsCloud’s B2B coffee location data in the USA, you can:
- Analyze competitor density.
- Identify white-space markets.
- Evaluate population clusters.
- Access the ZIP-level coffee shop POI and foot traffic trend in the USA.
- Track real-time store openings & closures.
How Location Intelligence Transforms Coffee Industry Decisions?
Location intelligence is a systematic process of combining maps with data to gain actionable insights. These insights are very useful for identifying patterns and making decisions for business in real-time. Businesses can use location intelligence to collect mobility and foot traffic data, POI data, demographic data, behavioral data, and more. POI data improves:
- Site selection: Identify high traffic zones.
- Franchise planning: Optimize location clusters.
- Investor modeling: Quantify market potential.
- Competitor tracking: Map rival store density.
- Market expansion strategy: Spot underserved regions.
LocationsCloud offers structured coffee shop POI data at a large scale, including
geospatial coordinates, store attributes, ZIP-level insights, and API access to drive precision in business decisions.
Get access to US coffee shop location data: Download state-wise dataset, coffee chain distribution map, and independent coffee shop list, or request a free coffee shop density report from LocationsCloud.
FAQ
There are around 145,629 coffee shops in the US.
The market size of the coffee shop industry in the US is $24.98 billion in 2026.
The best states to open a coffee shop in the US are many, but with 4,063 locations, California has the most coffee shops in the US.
For chains, the growth of coffee shops in the US is 2% annually, while independent shops are growing by 3.2% annually.
No, the independent coffee shops are not growing faster than chains, because the growth rate of independent coffee shops is just 2%, compared to a 3.2% growth rate for chains.
The average revenue of a coffee shop in the US is $75.5.
To find coffee shop location data in the US, you should use location intelligence.
Location intelligence is a process of combining maps with data to gain actionable insights for making informed business decisions.