Introduction
The transportation landscape is rapidly evolving in the U.S.A. The increasing use of electric vehicles has opened a new chapter of discussion: gas station vs EV charging station comparison. While gas stations are currently dominant, the EV charging machines are rapidly growing today because of the increasing demand within private sectors. In the year 2025, the maximum EV registration rate in California is 48.3% relative to other states. However, this percentage lags behind gas stations in key functionality such as speed and density. Understanding the core differences between gas stations and EV charge points is crucial for urban planners, store retailers, and policymakers alike. This research report will provide an in-depth differentiation of gas stations and EV charging.
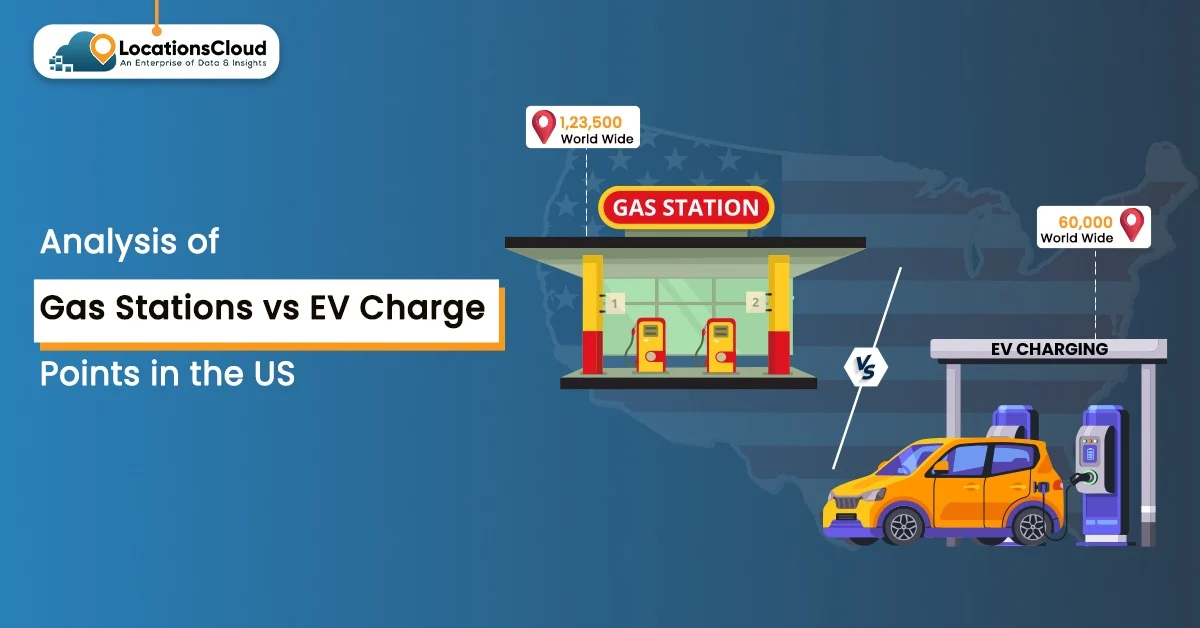
Market Overview: Gas Stations vs EV Chargers
There are ~145,000 gas stations nationwide in the USA. By comparison, there are only ~183,000 public charging ports, which is a significantly high number. Gasoline stations in America are evenly spread across urban and rural areas. On the other hand, EV infrastructure growth is concentrated in urban areas and is largely policy-driven. This electric vehicle charging network reflects fuel accessibility in various areas of the United States.
Overall, gas stations are now the dominant fuel supply; on the other hand, EV infrastructure is expanding via the NEVI and CFI programs. Supported by a stable infrastructure, fueling stations offer a more stable infrastructure than EV charging machines, with a 30% CAGR projected through 2030.
EV Charging Growth Compared to Gas Stations
EV growth predictions in the US are crucial, but it still lags behind gas stations. From 2020 to 2025, the growth of EV charging stations has increased; however, it has failed to surpass the total number of fuel depots in the USA. Rural EV infrastructure challenges stem from limited grid capacity due to a weak rural power network. However, local community-based charging stations empower businesses to overcome this situation. This can be understood more clearly through the following table.
| Year | Public EV Charging Stalls | Gas Stations in the US | Notes |
| 2020 | 26,000 | 121,000 | Recharge stations are limited to urban areas only. |
| 2021 | 32,500 | 121,500 | EV charging stations are growing in cities and major metro regions. |
| 2022 | 40,000 | 122,000 | The government provides incentives to expand EV charging networks. |
| 2023 | 48,000 | 122,500 | EV charging station growth in the US has increased in metropolitan areas. |
| 2024 | 55,000 | 123,000 | Established partnerships with Walmart, Sam’s Club, 7-Eleven, and other retail hubs for more sustainable energy solutions. |
| 2025 | 60,000 | 123,500 | Fast charges have increased with a focus on both rural and urban areas. |
The above tables illustrate that the total number of EV charging machines has increased significantly by 50% over the past few years, outpacing the growth of gas stations. Electric vehicle charging trends can be used by investors, automakers, policymakers, and fuel retailers to evaluate strategies and align with market demand. By scraping EV charger availability data, businesses can monitor usage in real time, predict demand, and place additional machines.
State-Wise EV and Gas Station Comparison Data in the US
| State | EV Charging Stations in 2025 | Gas Stations in 2025 | EVs per charging port. |
| California | 930,000 | 12,000 | 5.2 |
| Texas | 220,000 | 10,000 | 12.8 |
| Florida | 175,000 | 7,500 | 10.1 |
| New York | 150,000 | 6,500 | 8.9 |
| New Jersey | 95,000 | 4,500 | 6.5 |
The comparison of EV and gas stations is presented in the table above, highlighting a decrease in gas station growth trends across America. We can see that California has the most EV charging infrastructure in the US. Additionally, this trend is leading to more EV charging stations, while traditional continue to be distributed across states. Businesses can scrape this data to collect comprehensive information on customer preferences and usage patterns for competitive analysis and staying ahead.
Region-Wise EV Charging Station Location Data in the US
The increasing adoption of electric vehicles in the United States leads to more EV charging stations. Top US regions like California, New York, and Florida have the highest number of EV stations. Other regions like Montana and West Virginia do not even have 2000 charge points. The analysis of POI data for EV charge points mentioned below shows the cluster of machines near business stations, hotels, and malls.
| Region | EV charge points in the US | Population (Millions) | EV Station per 1M People |
| California | 930,000 | 40 | 23,250 |
| Florida | 175,000 | 22 | 7,950 |
| New York | 150,000 | 19 | 7,900 |
| Montana | 850 | 1.1 | 773 |
| West Virginia | 1,200 | 1.8 | 667 |
With the highest number of EV charging stations and ports per million residents, California remains at the top among all regions. This heavily impacted the auto industry, with a boost in EV sales. Businesses should adopt a hybrid expansion strategy to diversify risk and balance investment.
Economic Currents: Revenue and Market Growth
Gas stations have $121 billion in overall industry revenue, representing a slight decline of 0.9%. This gas station decline percentage reflects lower sales with a decrease in consumer demand. Despite a minor reduction in revenue, profitability remains stable in the mature and resilient sector. However, businesses earn income by selling petrol for motorcycles, cars, and hybrid vehicles.
EV charging points represent a $423 million market value in the USA. Driven by 31%, the charging station infrastructure is expanding rapidly. The policy-driven investment helps industries to achieve this significant growth.
Why Scrape Gas Station Location Data in the US
Gas station location intelligence is derived through a comprehensive analysis. By utilizing data scraping services, energy companies, policymakers, investors, and site planners can understand market trends and track fuel demand. They can map competitors and identify nearby stations. Extracting accurate station addresses, GPS coordinates, brand affiliations, fuel types offered, and price information helps businesses drive innovation and lead in the market. EV operators can incorporate the following data to smartly identify gaps in the market.
| State | Gas Stations | Population in Millions | Stations per 1M People |
| California | 12,000 | 40 | 300 |
| Texas | 10,000 | 29 | 345 |
| Florida | 7,500 | 22 | 341 |
| New York | 6,500 | 19 | 342 |
| Ohio | 5,800 | 11 | 527 |
Why Scrape EV Charger Availability Data?
Monitoring EV charger availability, including charger type, availability count, operating hours, energy source, and network providers, helps businesses expand market reach and gain competitive advantages. Scraped data empowers operators to forecast demand and optimize EV charge points.
| Year | Average EV Charger Availability in % | Peak Demand Hours | Notes |
| 2020 | 65 | 7–9 AM | Higher station usage. |
| 2021 | 60 | 5–7 PM | DC fast charging hubs and smart charging apps are introduced. |
| 2022 | 55 | 6–8 PM | Workspace EV usage rises. |
| 2023 | 50 | 7–9 PM | Introduced corridor fast-charging. |
| 2024 | 45 | 5–7 PM | Integrated smart grid. |
| 2025 | 40 | 6–8 PM | More stations were introduced. |
Businesses can combine real-time availability data with EV gas station information to compare options, improve operations, services, and customer satisfaction. Firms can leverage advanced analytics to meet the EV adoption trend in the USA.
Why Use LocationsCloud for Location Intelligence?
LocationsCloud provides a wide range of comprehensive real-time data insights to enable faster decisions. Location intelligence for fuel stations helps businesses select a smart site and maximize business success. It helps logistics and supply chain businesses to map customer behavior to improve marketing strategy. By using a competitive analysis tool, businesses will be able to identify market gaps clearly. Businesses even use location data to optimize resource usage and cut operational expenses.
With Location intelligence for EV infrastructure provided by LocationsCloud, investors can improve accessibility and serve underserved areas. It allows real estate developers to enhance customer convenience by providing easy access to charging. This supports sustainability and significantly boosts EV adoption. Traffic flow analysis enables infrastructure developers to place chargers strategically.
Conclusion
Examination of Gas Stations and EV charge points in the US is necessary for infrastructure planning and consumer accessibility. The research provides a detailed overview of how these two types of refueling systems can effectively predict future trends and stay competitive in the market. EV operators, businesses, and policymakers can understand the revenue model of these sustainable energy infrastructures. LocationsCloud leverages next-generation systems and a future-proof setup to deliver highly accurate and reliable location data. Businesses can rely on it to collect real-time location data.